Ta strona wykorzystuje pliki cookies. Korzystając ze strony, zgadzasz się na ich użycie. OK Polityka Prywatności Zaakceptuj i zamknij X

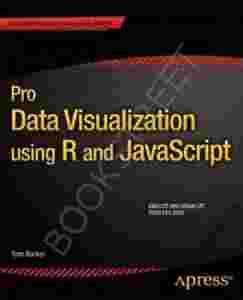
PRO DATA VISUALIZATION USING R AND JAVASCRIPT

18-02-2014, 14:29
Aukcja w czasie sprawdzania była zakończona.
Cena kup teraz: 220.50 zł     
Użytkownik bookstreet
numer aukcji: 3898733350
Miejscowość Kalisz
Wyświetleń: 4   
Koniec: 18-02-2014 11:25:29

Dodatkowe informacje:
Stan: Nowy
Okładka: miękka
Rok wydania (xxxx): 2013
Kondycja: bez śladów używania
Język: angielski
info Niektóre dane mogą być zasłonięte. Żeby je odsłonić przepisz token po prawej stronie. captcha

978<span class=hidden_cl>[zasłonięte]</span><span class=hidden_cl>[zasłonięte]</span>09236, 978<span class=hidden_cl>[zasłonięte]</span><span class=hidden_cl>[zasłonięte]</span>72560, 978<span class=hidden_cl>[zasłonięte]</span><span class=hidden_cl>[zasłonięte]</span>71417, 978<span class=hidden_cl>[zasłonięte]</span><span class=hidden_cl>[zasłonięte]</span>02580, 978<span class=hidden_cl>[zasłonięte]</span><span class=hidden_cl>[zasłonięte]</span>95801, 978-<span class=hidden_cl>[zasłonięte]</span><span class=hidden_cl>[zasłonięte]</span>09236, 978-<span class=hidden_cl>[zasłonięte]</span><span class=hidden_cl>[zasłonięte]</span>72560, 978-<span class=hidden_cl>[zasłonięte]</span><span class=hidden_cl>[zasłonięte]</span>71417, 978-<span class=hidden_cl>[zasłonięte]</span><span class=hidden_cl>[zasłonięte]</span>02580, 978-<span class=hidden_cl>[zasłonięte]</span><span class=hidden_cl>[zasłonięte]</span>95801


TEL: 607-[zasłonięte]-671
GG: [zasłonięte]16851
EMAIL: [zasłonięte]@bookstreet.pl


Kupując kilka książek za wysyłkę płacisz tylko raz! 

Do realizacji zamówienia przystępujemy po otrzymaniu zapłaty za towar lub wybraniu opcji przesyłki za pobraniem. Książki wysyłamy w ciągu 5-7 dni roboczych, nie ma możliwości szybszej realizacji.
Wystawiamy faktury VAT.


Paczkomaty InPost


Pro Data Visualization using R and JavaScript (Professional Apress)

PRO DATA VISUALIZATION USING R AND JAVASCRIPT


PRODUCT DETAILS:
Author: Tom Barker
Language: English
Publisher: APRESS
Publication Date: 19 Jun 2013
Dimensions: 19.1 x 23.5 cm
Format: Paperback
Pages: 300
Condition: NEW
Product_ID: 14CAB5D063


Pro Data Visualization using R and JavaScript makes the R language approachable, and promotes the idea of data gathering and analysis. You'll see how to use R to interrogate and analyze your data, and then use the D3 JavaScript library to format and display that data in an elegant, informative, and interactive way. You will learn how to gather data effectively, and also how to understand the philosophy and implementation of each type of chart, so as to be able to represent the results visually.

With the popularity of the R language, the art and practice of creating data visualizations is no longer the preserve of mathematicians, statisticians, or cartographers. As technology leaders, we can gather metrics around what we do and use data visualizations to communicate that information. Pro Data Visualization using R and JavaScript combines the power of the R language with the simplicity and familiarity of JavaScript to display clear and informative data visualizations.

Gathering and analyzing empirical data is the key to truly understanding anything. We can track operational metrics to quantify the health of our products in production. We can track quality metrics of our projects, and even use our data to identify bad code. Visualizing this data allows anyone to read our analysis and easily get a deep understanding of the story the data tells.

What you’ll learn

  • A rich understanding of how to gather, and analyze empirical data
  • How to tell a story with data using data visualizations
  • What types of data visualizations are best to use for the story that you want to tell with your data
  • A comprehensive introduction to the R language, covering all the essentials 
  • Exploration of how to construct interactive data visualizations using JavaScript and JavaScript libraries

Who this book is for


Developers at all levels interested in data visualization, beginning to intermediate engineering managers, statisticians, mathematicians, economists and any others interested in data visualization.

Table of Contents

  1. Techniques for Data Visualization 
  2. The R Language 
  3. A Deeper Dive into R 
  4. Data Visualization with D3 
  5. Visualizing Spatial Information from Access Logs (Data Maps) 
  6. Visualizing Defects over Time (Time Series) 
  7. Bar Charts 
  8. Correlation Analysis with Team Dynamics (Scatterplot and Bubble Chart)
  9. Balancing Delivery with Quality (Parallel Coordinates Chart)


Książki wysyłamy w ciągu 5-7 dni roboczych.


 INTERACTIVE DATA VISUALIZATION FOR THE WEB Murray

 DATA VISUALIZATION WITH D3.JS Swizec Teller

 DATA VISUALIZATION: A SUCCESSFUL DESIGN PROCESS