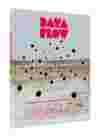
More and more information is being visualised. Diagrams, data and information graphics are utilised wherever increasingly complex elements are present, whether it is in magazines, non-fiction books or business reports, packages or exhibition designs.
Data Flow presents an abundant range of possibilities in visualising data and information. Today, diagrams are being applied beyond their classical fields of use. In addition to archetypical diagrams such as pie charts and histograms, there are manifold types of diagrams developed for use in distinct cases and categories. These range from chart-like diagrams such as bar, plot, line diagrams and spider charts, graph-based diagrams including line, matrix, process flow, and molecular diagrams to extremely complex three-dimensional diagrams.
The more concrete the variables, the more aesthetically elaborate the graphics – sometimes reaching the point of art – the more abstract, the simpler the readability. The abundant examples in Data Flow showcase the various methodologies behind information design with solutions concerning complexity, simplification, readability and the (over)production of information. In addition to the examples shown, the book features explanatory text.
On 256 pages, Data Flow introduces a comprehensive selection of innovatively designed diagrams. This up-to-date survey provides inspiration and concrete solutions for designers, and at the same time unlocks a new field of visual codes.


